If you would like to view the statistics for all activity, for all ads on your account, follow the steps below.
Click ‘Member Center.’

Click the ‘Statistics’ tab.
In the upper-right corner of the screen, there is a drop-down menu to select the time frame for which you would like to view statistics. Once the time frame is selected, the graphs and tables will update to reflect the selected time frame.
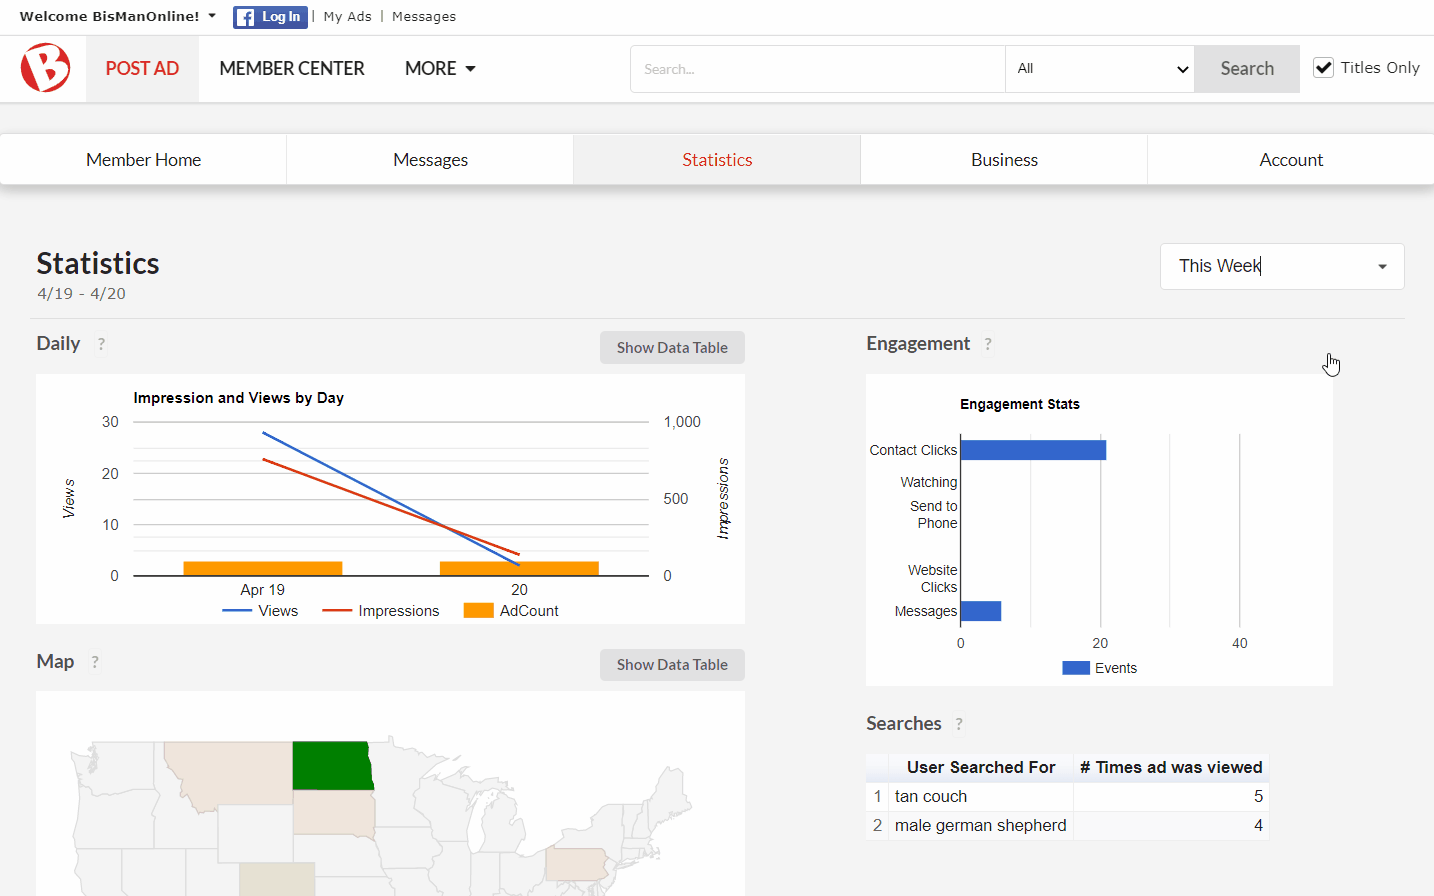
The line/bar graph in the upper-left corner tracks your daily ad impressions and views. The blue line represents your views, the red line represents your impressions, and the yellow bars represent your ad count. Hovering over the various points of either of the two lines, or the yellow bars, with your mouse, the date and exact view, impression, or ad count will display. Click the question mark next to ‘Daily’ for a full explanation of each of these terms. To close the explanation window, click ‘Ok.’
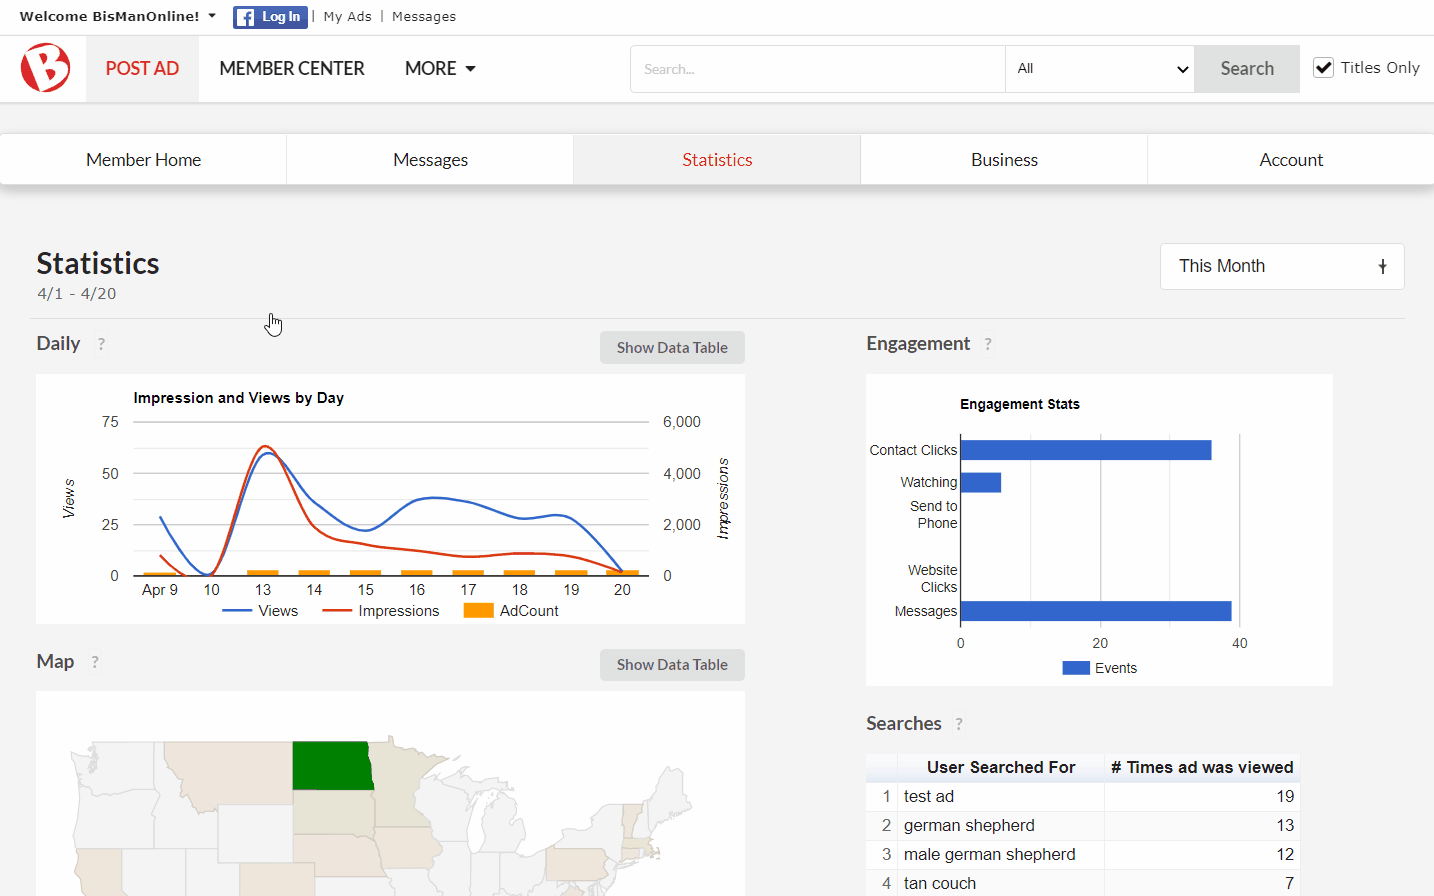
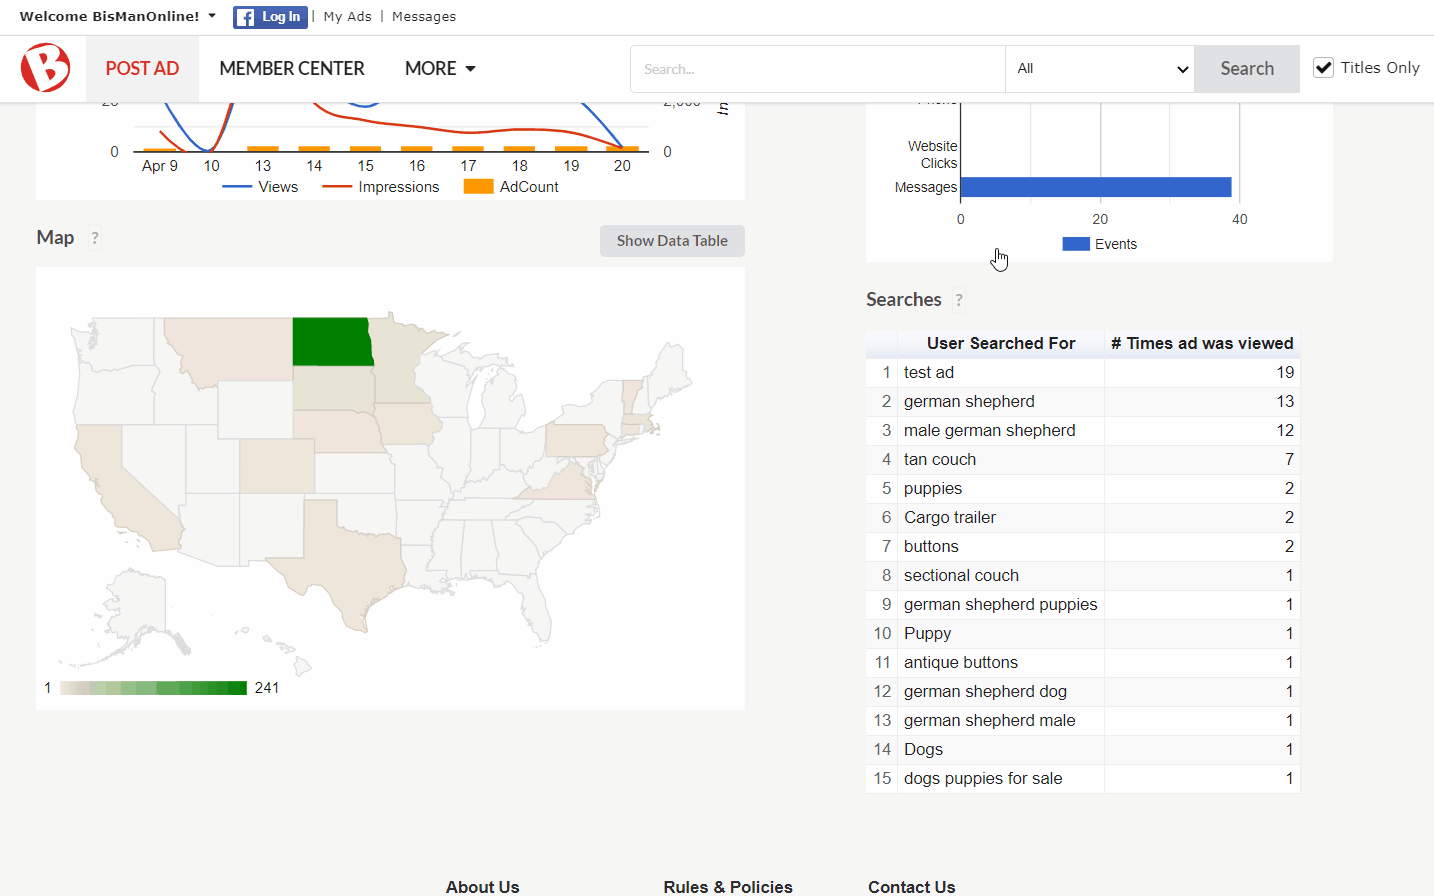
The bar graph in the upper-right corner tracks your ad engagements, or the ways in which other users have interacted with your ad. Hovering over any of the bars will display the total number of events for that type of engagement. Click the question mark next to ‘Engagement’ for a full explanation of each type of engagement. To close the explanation window, click ‘Ok.’

The map in the lower-left corner tracks the locations from which users have viewed your ad(s). Hovering over any of the states will give you the total view count for that state. Click on the question mark next to ‘Map’ for instructions on how you can further interact with the map. To close the instructions window, click ‘Ok.’
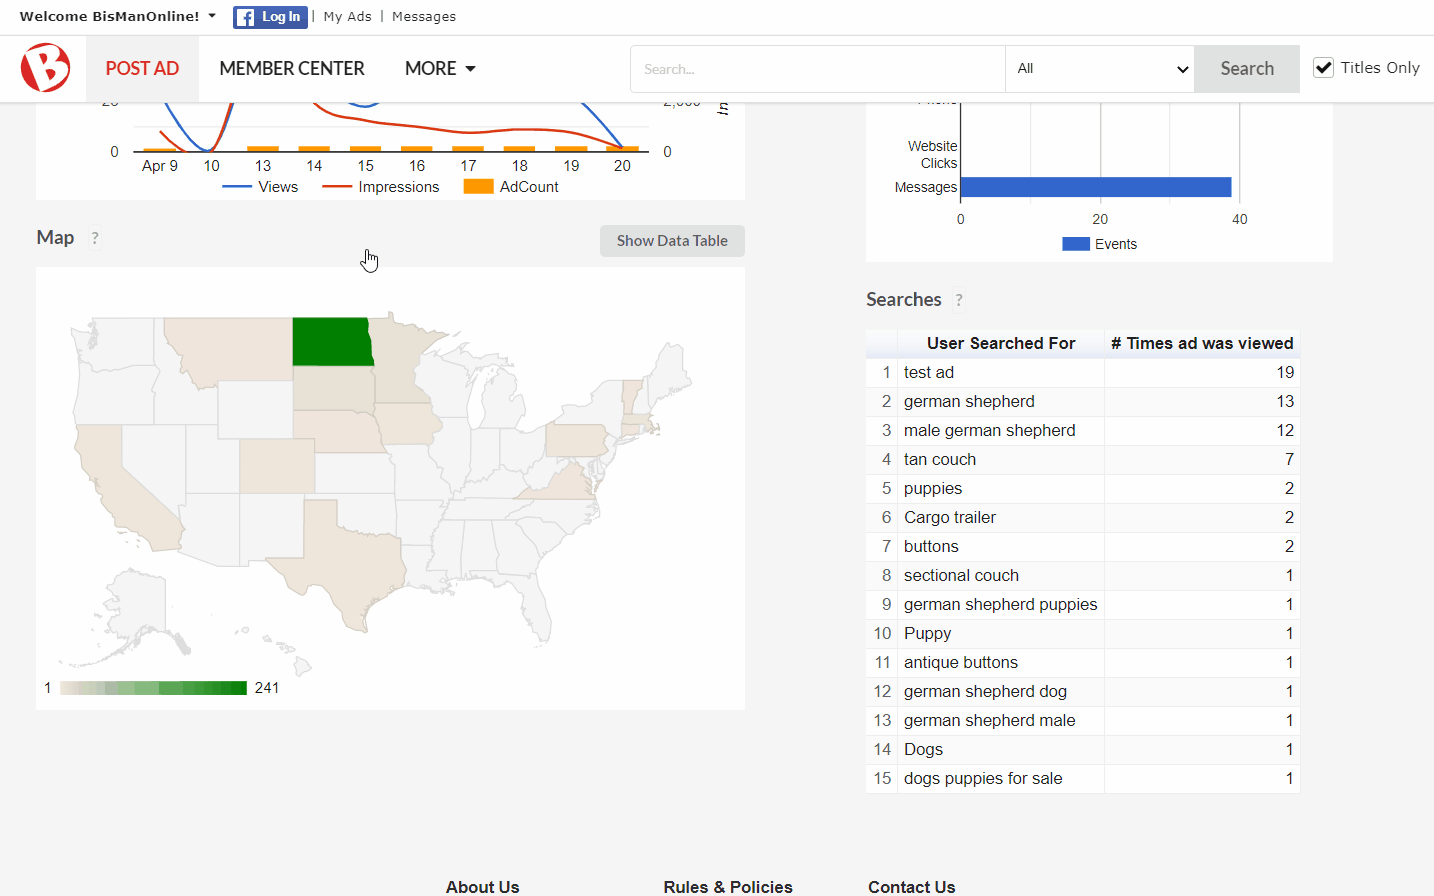
The table in the lower-right corner tracks searches that were conducted on BisManOnline that led people to click on your ad(s). Click on the question mark next to ‘Searches’ for further explanation on the use of this table. To close the explanation window, click ‘Ok.’
If you would like to view the statistics for all activity, for all ads on your account, follow the steps below.
Click the Member Center icon.
Click ‘Stats.’
In the upper-right corner of the screen, there is a drop-down menu to select the time frame for which you would like to view statistics. Once the time frame is selected, the graphs and tables will update to reflect the selected time frame.

The ‘Daily’ line/bar graph tracks your daily ad impressions and views. The blue line represents your views, the red line represents your impressions, and the yellow bars represent your ad count. Tapping on various points on either of the two lines, or the yellow bars, the date and exact view, impression, or ad count will display. Click the question mark next to ‘Daily’ for a full explanation of each of these terms. To close the explanation window, tap anywhere outside of the window.
The ‘Map’ tracks the locations from which users have viewed your ad(s). Tapping on any of the states will give you the total view count for that state. Click on the question mark next to ‘Map’ for instructions on how you can further interact with the map. To close the instructions window, tap anywhere outside of the window.
The ‘Engagements’ bar graph tracks your ad engagements, or the ways in which other users have interacted with your ad. Tapping any of the bars will display the total number of events for that type of engagement. Click the question mark next to ‘Engagement’ for a full explanation of each type of engagement. To close the explanation window, tap anywhere outside of the window.
The ‘Searches’ table tracks searches that were conducted on BisManOnline that led people to click on your ad. Click on the question mark next to ‘Searches’ for further explanation on the use of this table. To close the explanation window, click anywhere outside of the window.
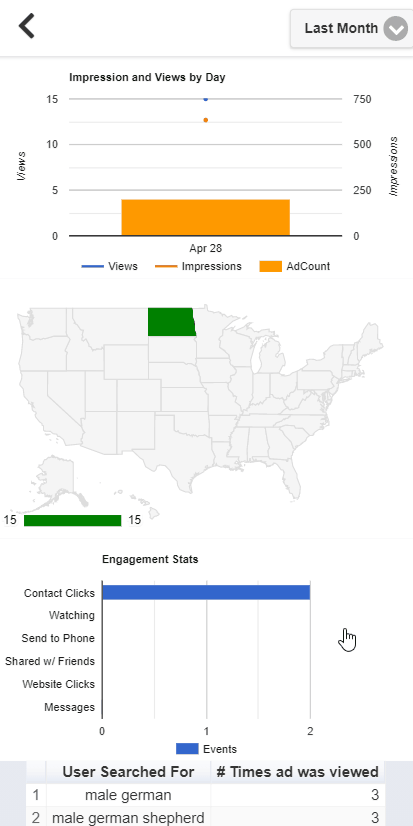
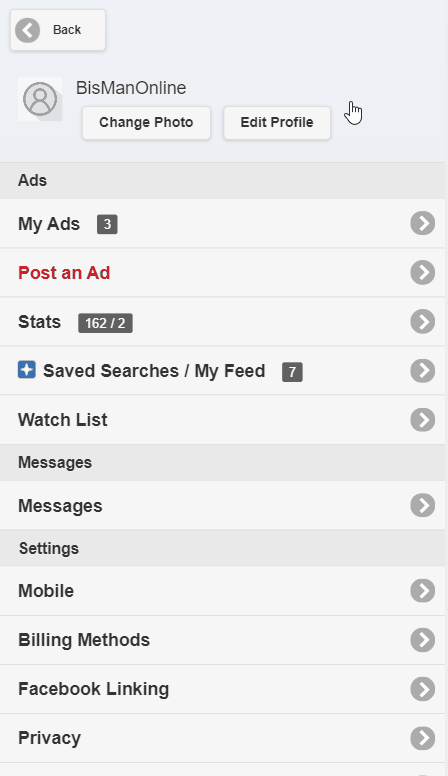
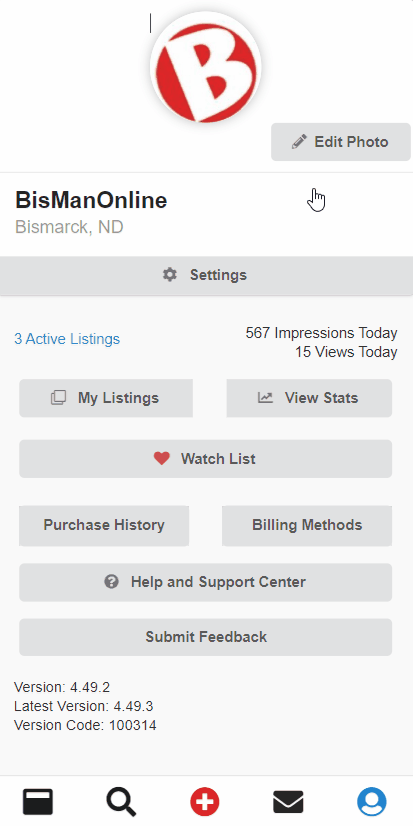
If you would like to view the statistics for all activity, for all ads on your account, follow the steps below.
Click the Person icon.
![]()
Click ‘View Stats.’
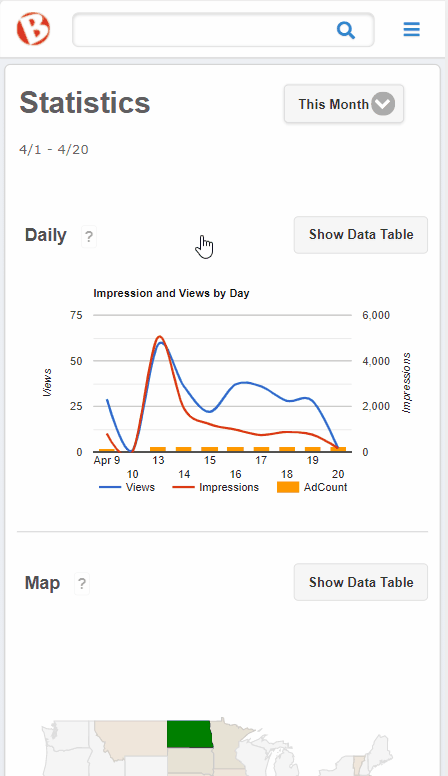
In the upper-right corner of the screen, there is a drop-down menu to select the time frame for which you would like to view statistics. Once the time frame is selected, the graphs and tables will update to reflect the selected time frame.
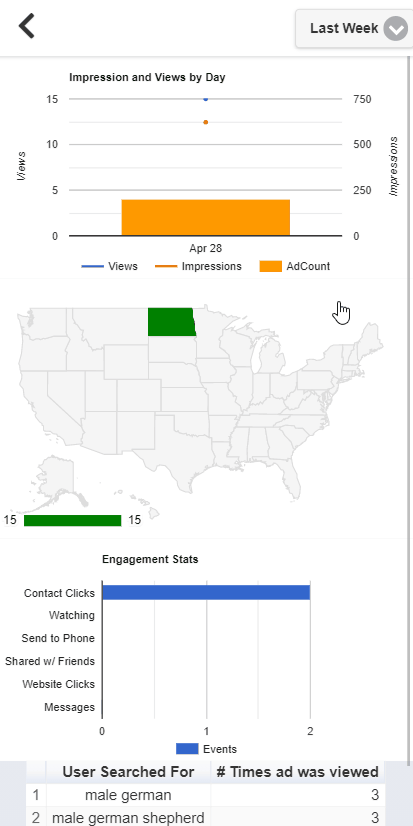
The ‘Impressions and Views by Day’ line/bar graph tracks your daily ad impressions and views. The blue line represents your views, the red line represents your impressions, and the yellow bars represent your ad count. Tapping on various points on either of the two lines, or the yellow bars, the date and exact view, impression, or ad count will display.
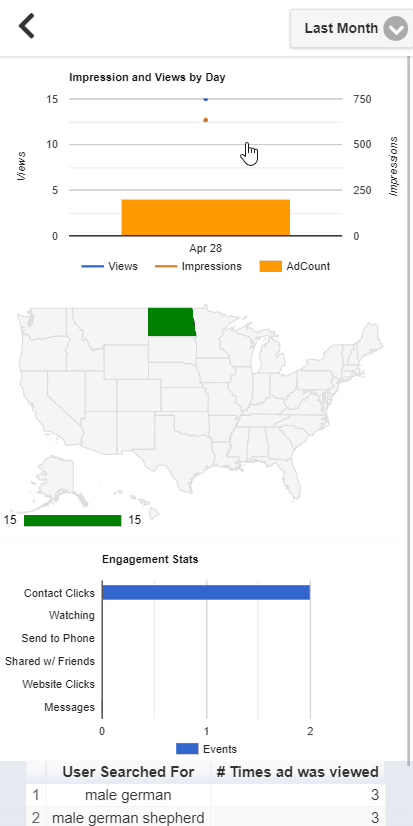
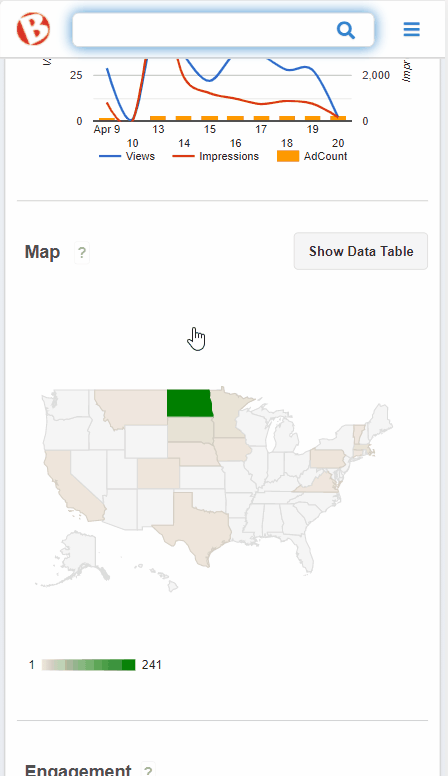
The map tracks the locations from which users have viewed your ad(s). Tapping on any of the states will give you the total view count for that state.

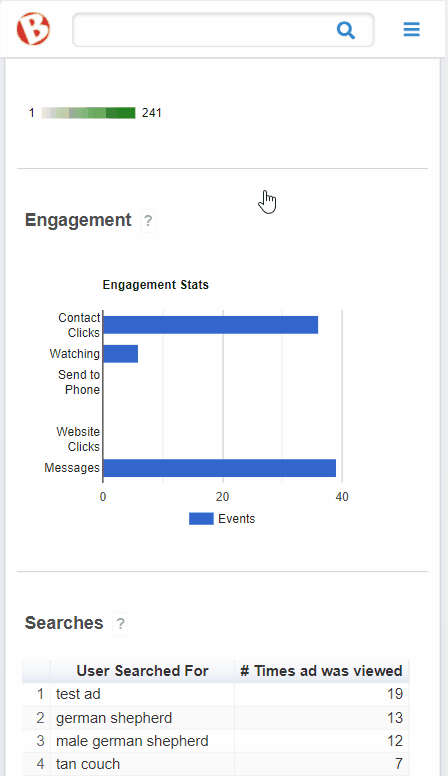
The ‘Engagement Stats’ bar graph tracks your ad engagements, or the ways in which other users have interacted with your ad. Tapping any of the bars will display the total number of events for that type of engagement.
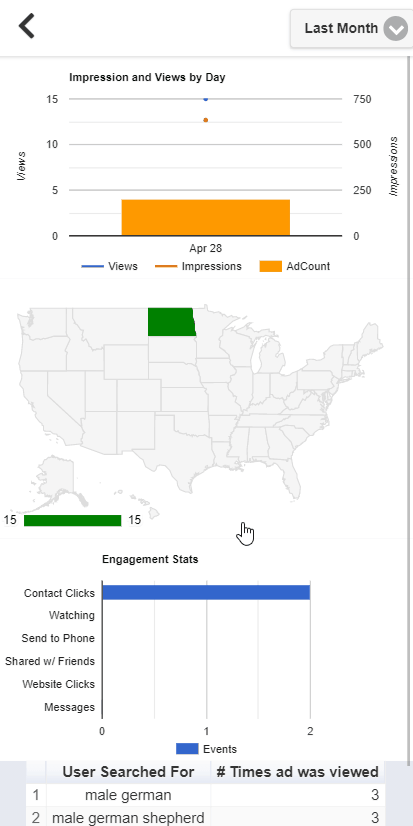
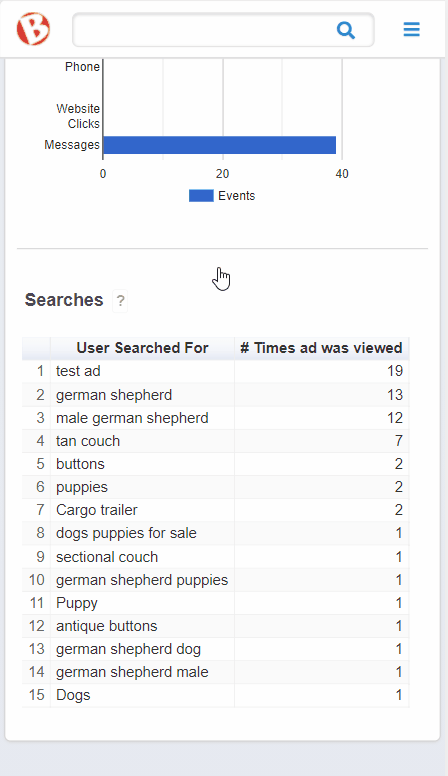
The table tracks searches that were conducted on BisManOnline that led people to click on your ad.