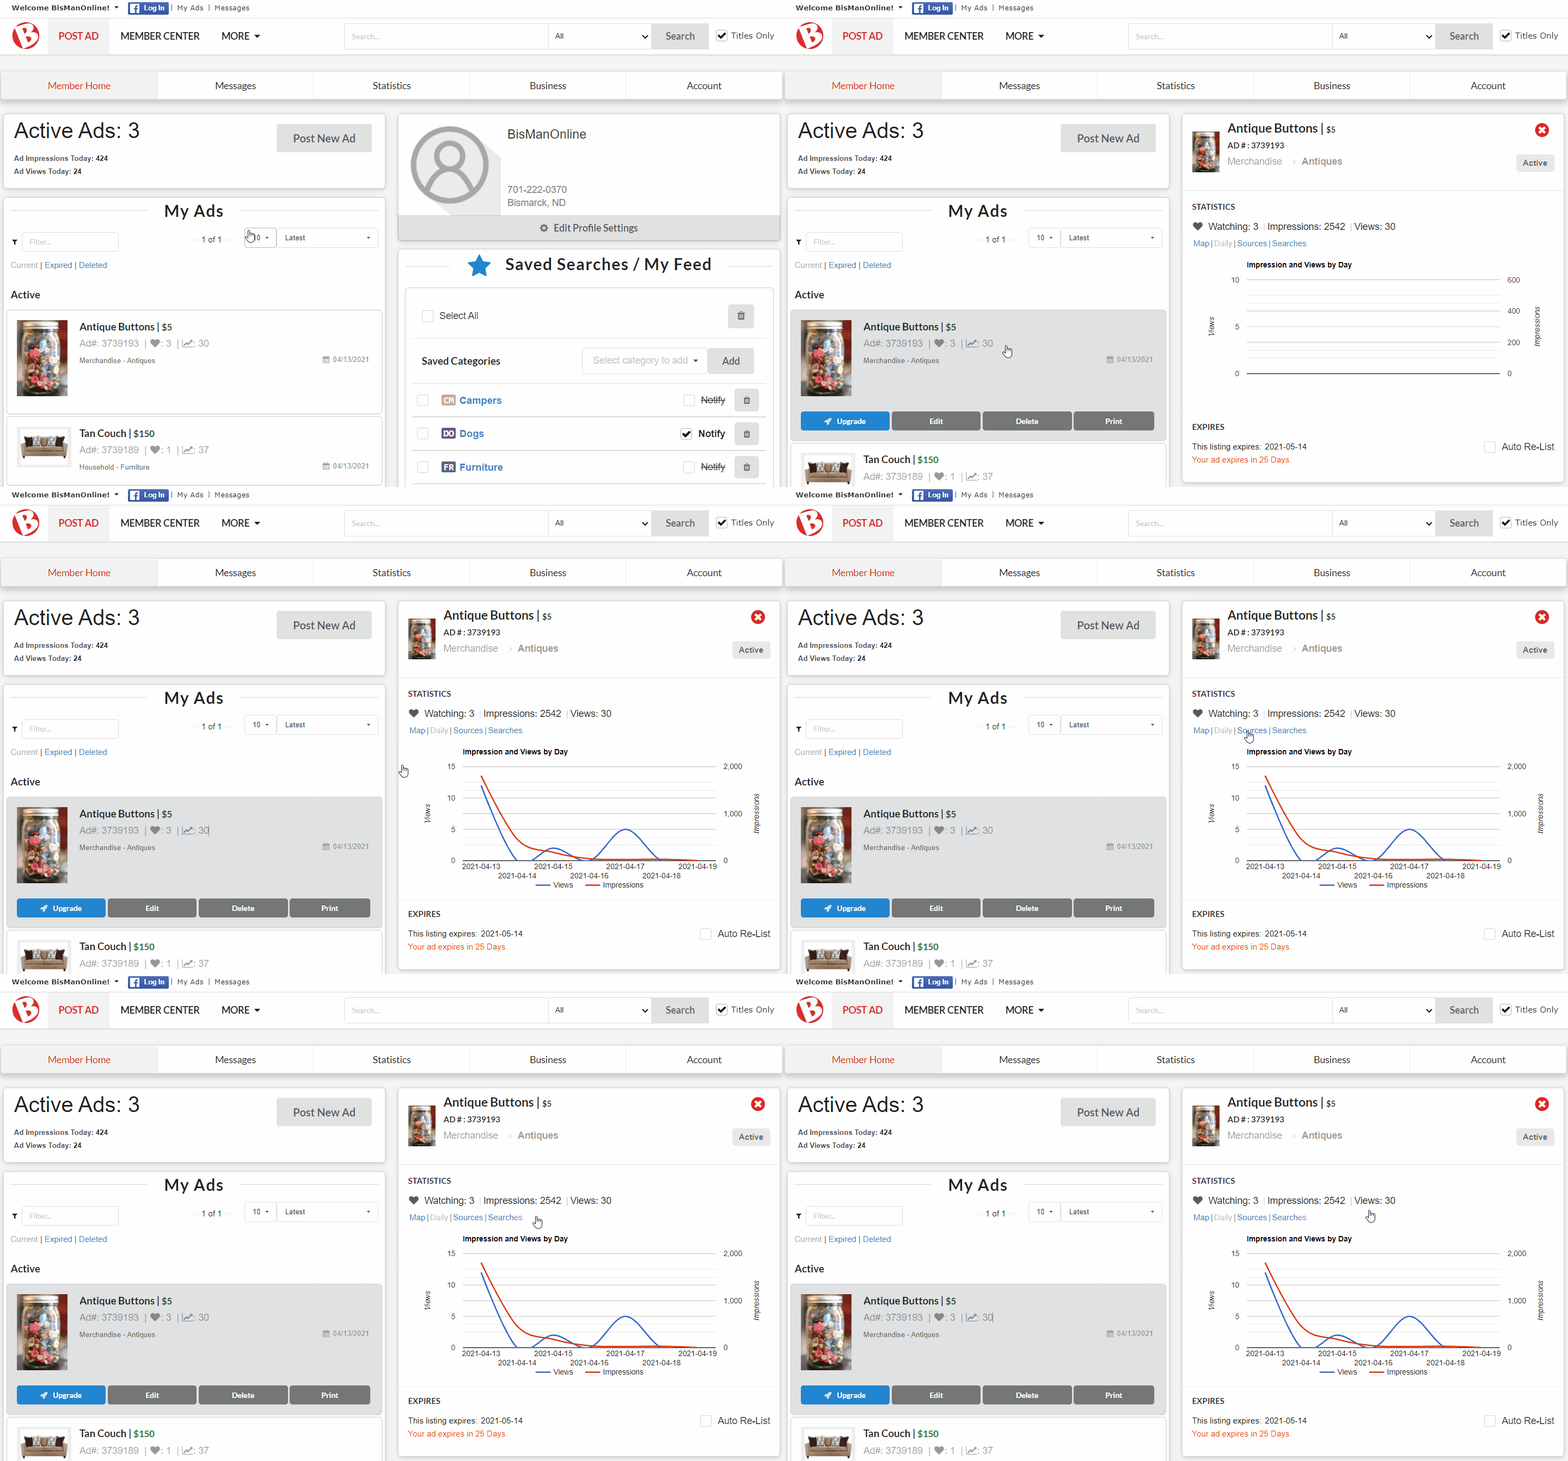
To view an ad’s statistics, log in to your BisManOnline account and click ‘Member Center.’

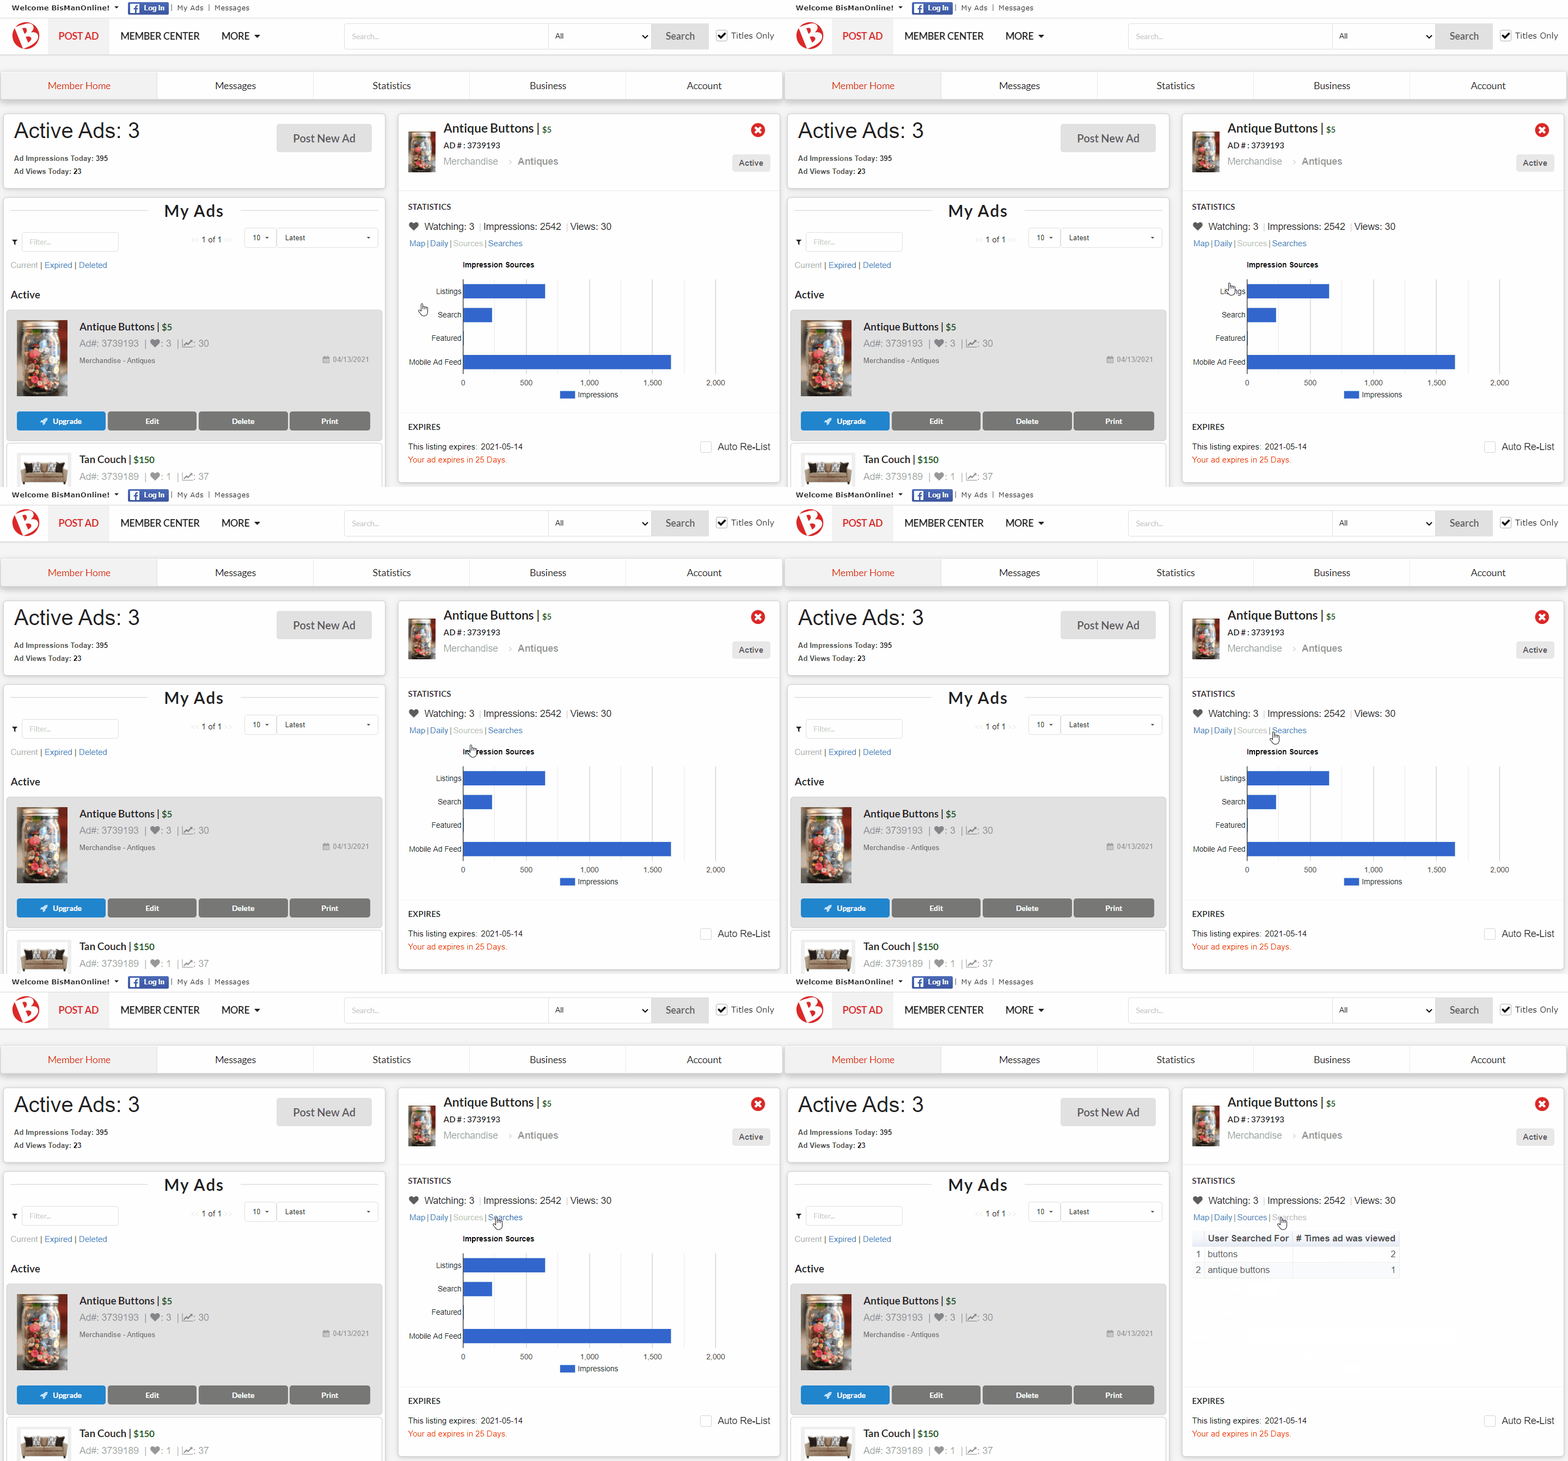
Underneath ‘My Ads,’ click on the ad for which you would like to view the statistics. This will change the window on the right side of the screen to display that ad’s statistics, the first of which includes the total Watching, Impressions, and Views for the entire period the ad has been listed. For an explanation of these terms, please view our support topic Differences Between Watching, Impressions, & Views.
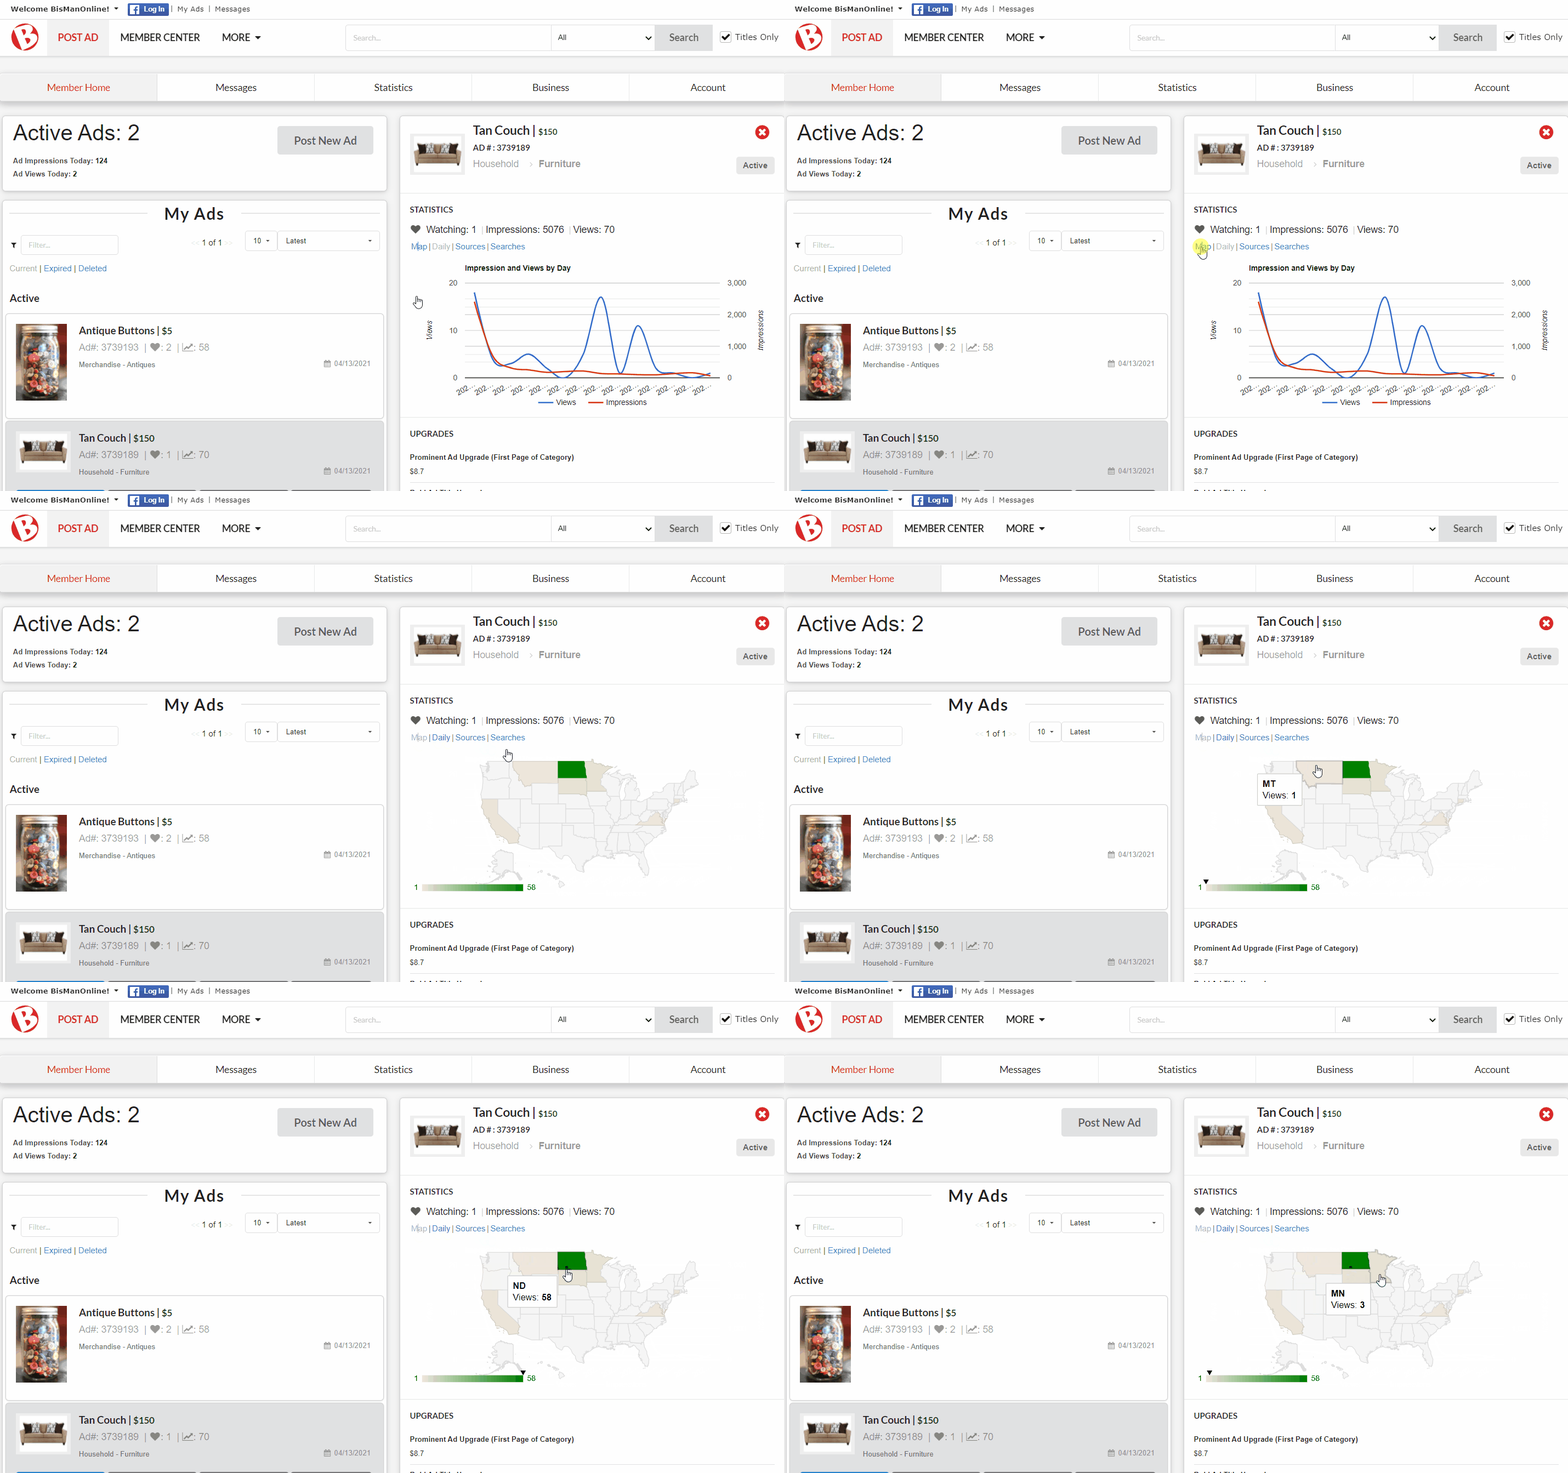
Click ‘Map.’ This map tracks the locations from which users have viewed your ads. These locations are determined by using the IP Address of the computer that viewed your ad. Hovering over any of the states will give you the total view count for that state.
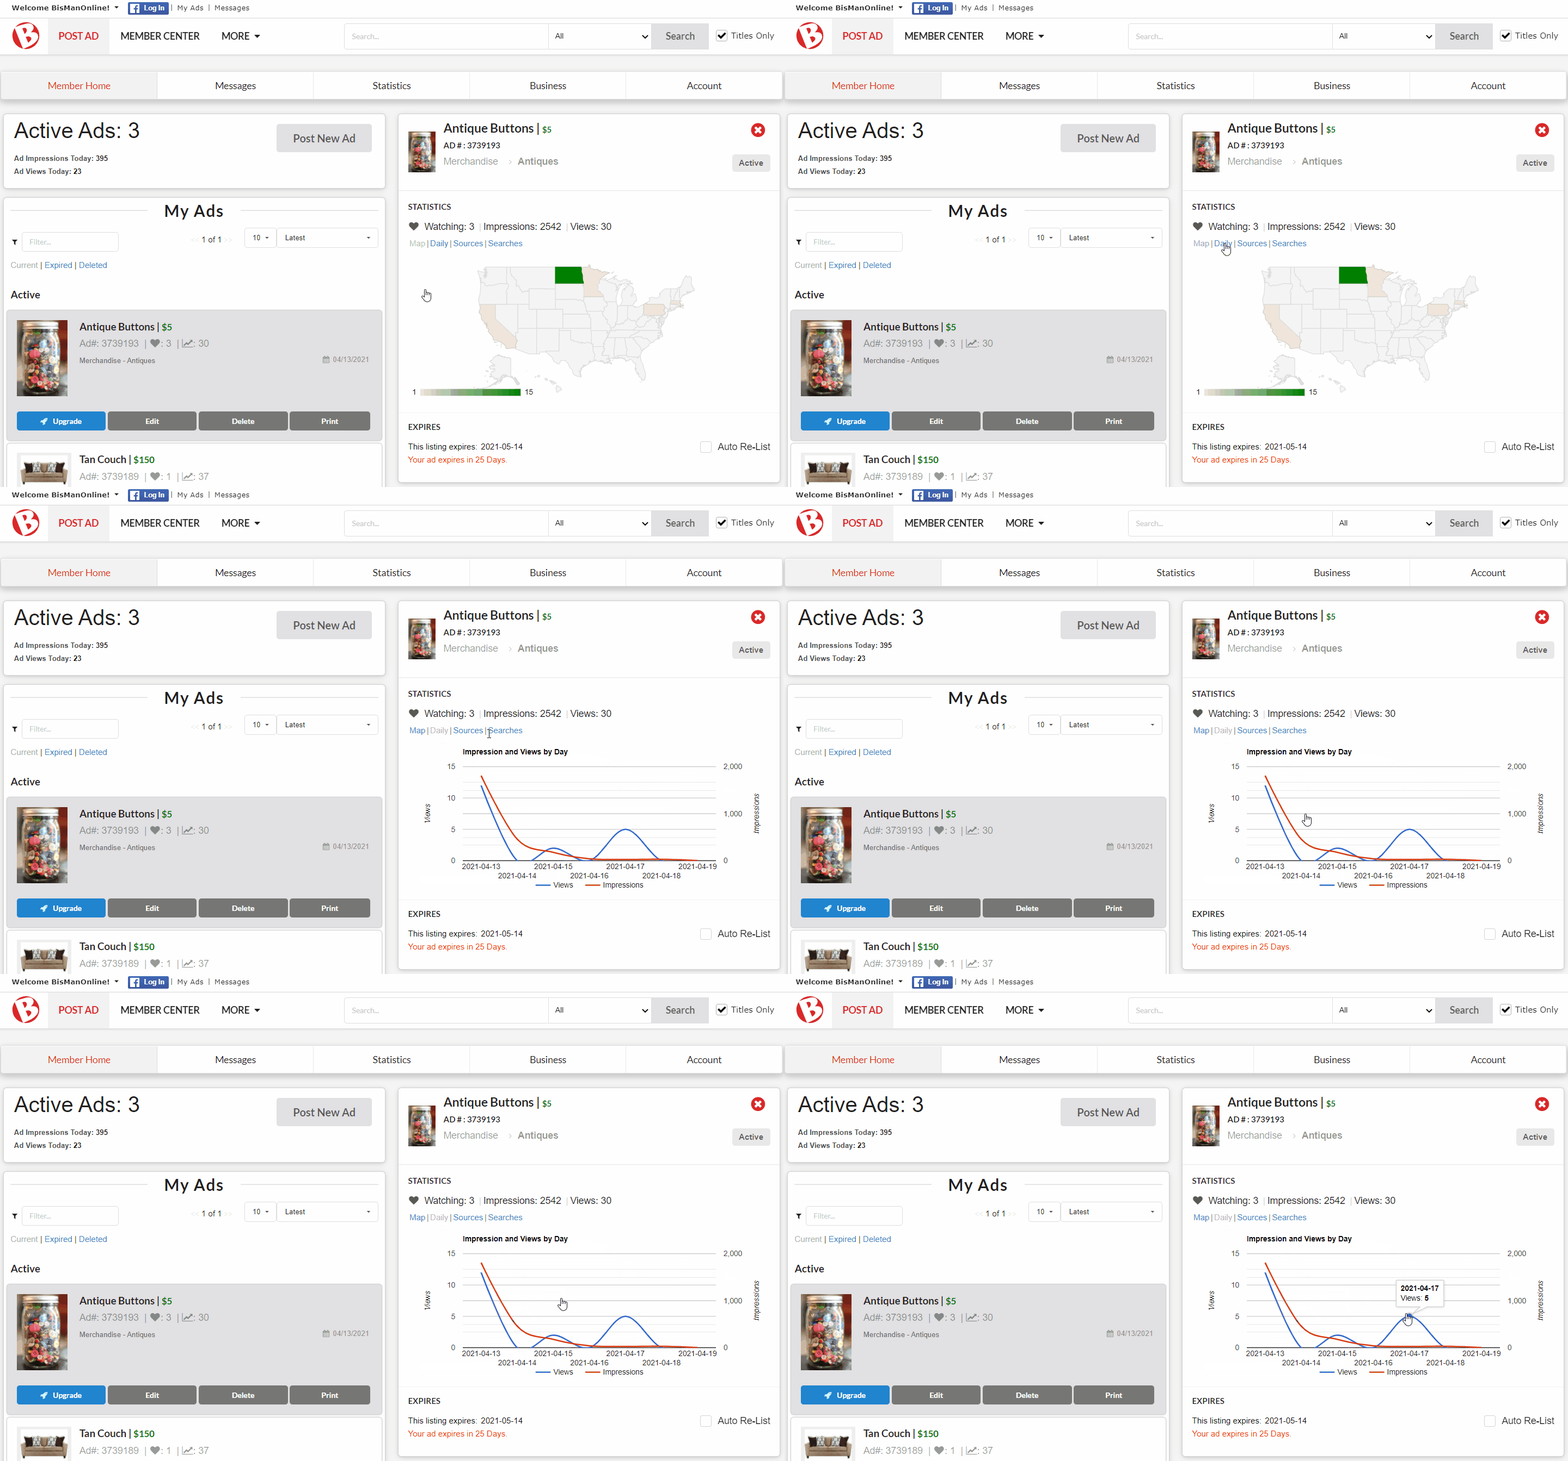
Click ‘Daily.’ This line graph tracks the impressions and views that your ad receives each day. The blue line represents your views, and the red line represents your impressions. Hovering over the various points of either of the two lines with your mouse, the date and exact view or impression count will display.
Click ‘Sources.’ This bar graph tracks from which areas on the site you are receiving your impressions. Hovering over any of the bars will display the total impression count for that source.
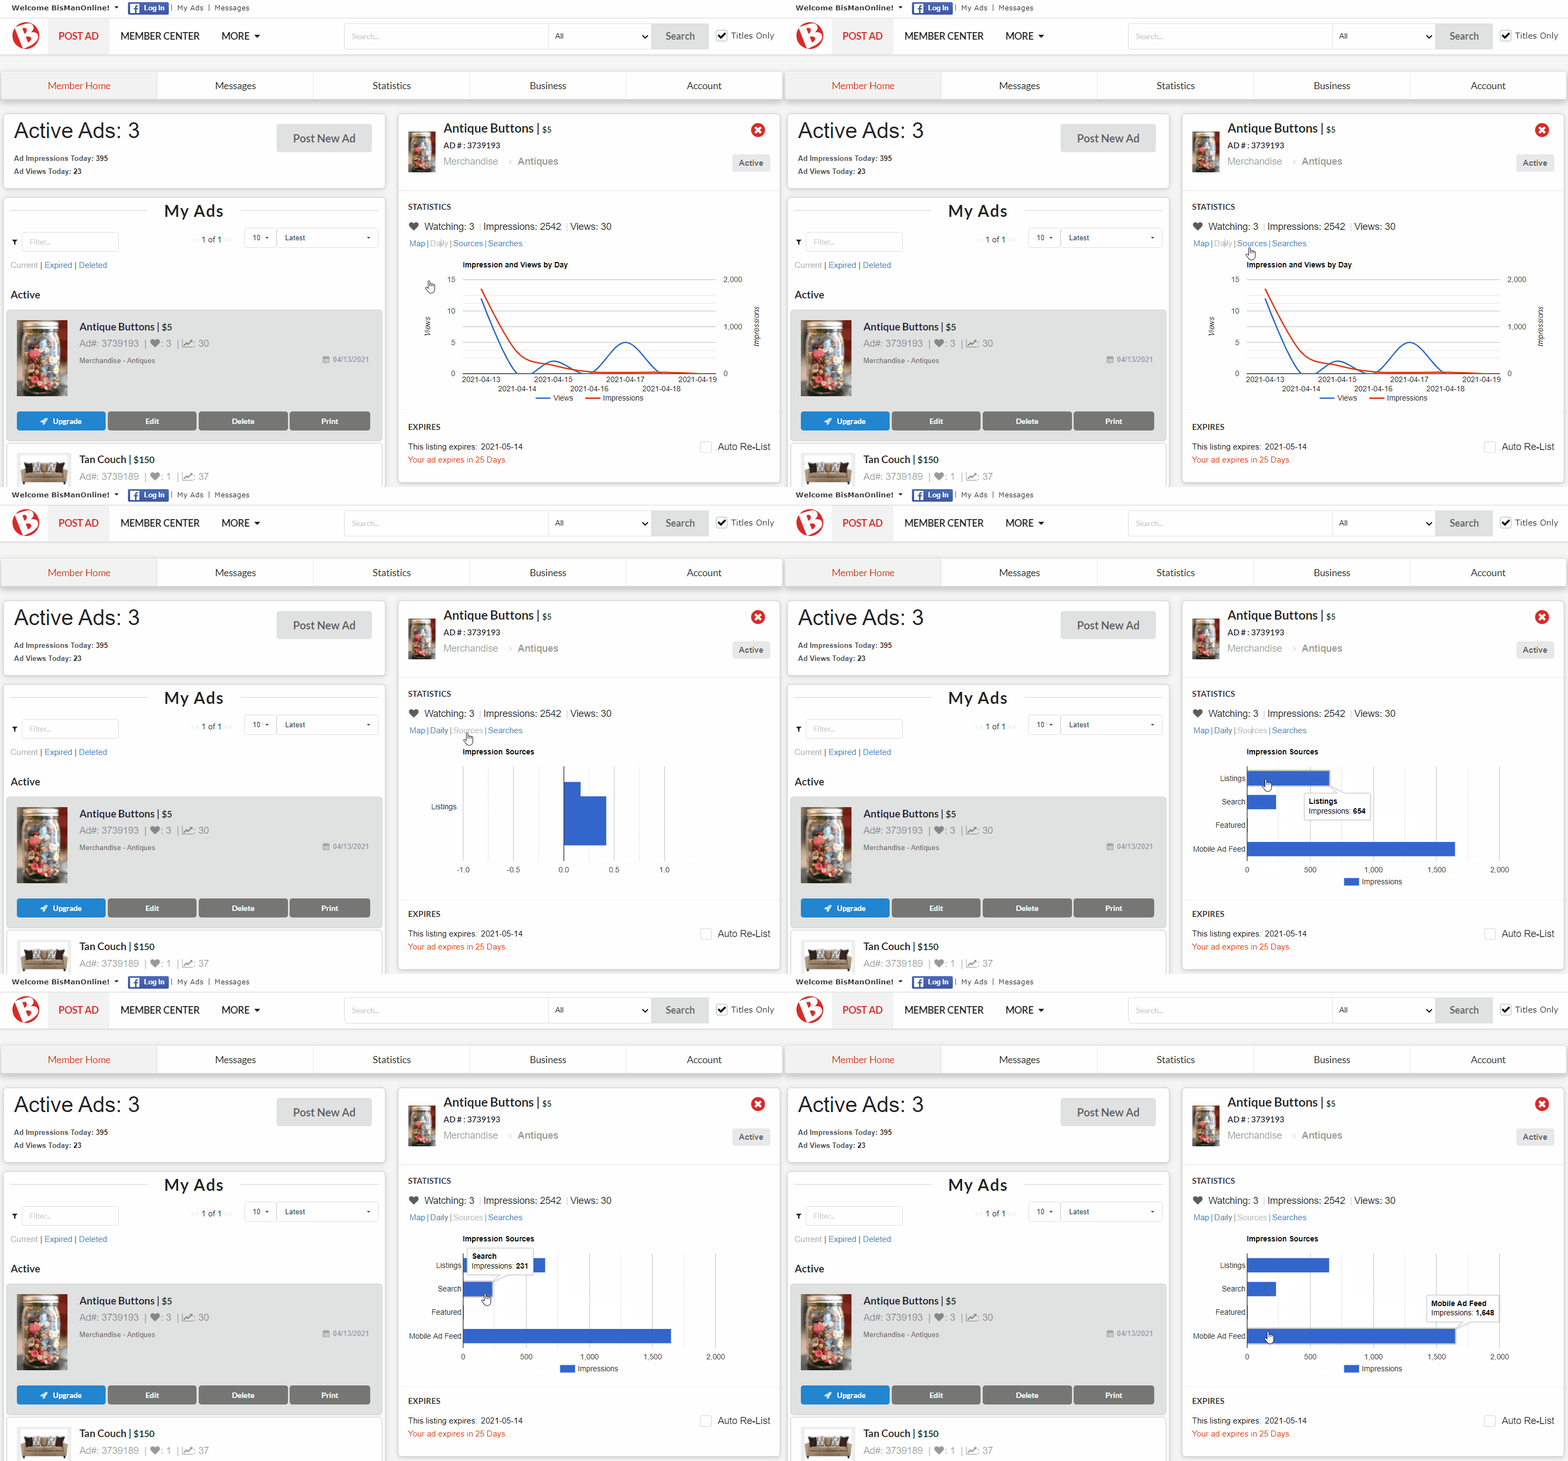
Click ‘Searches.’ This table tracks searches that were conducted on BisManOnline that led people to click on your ad.
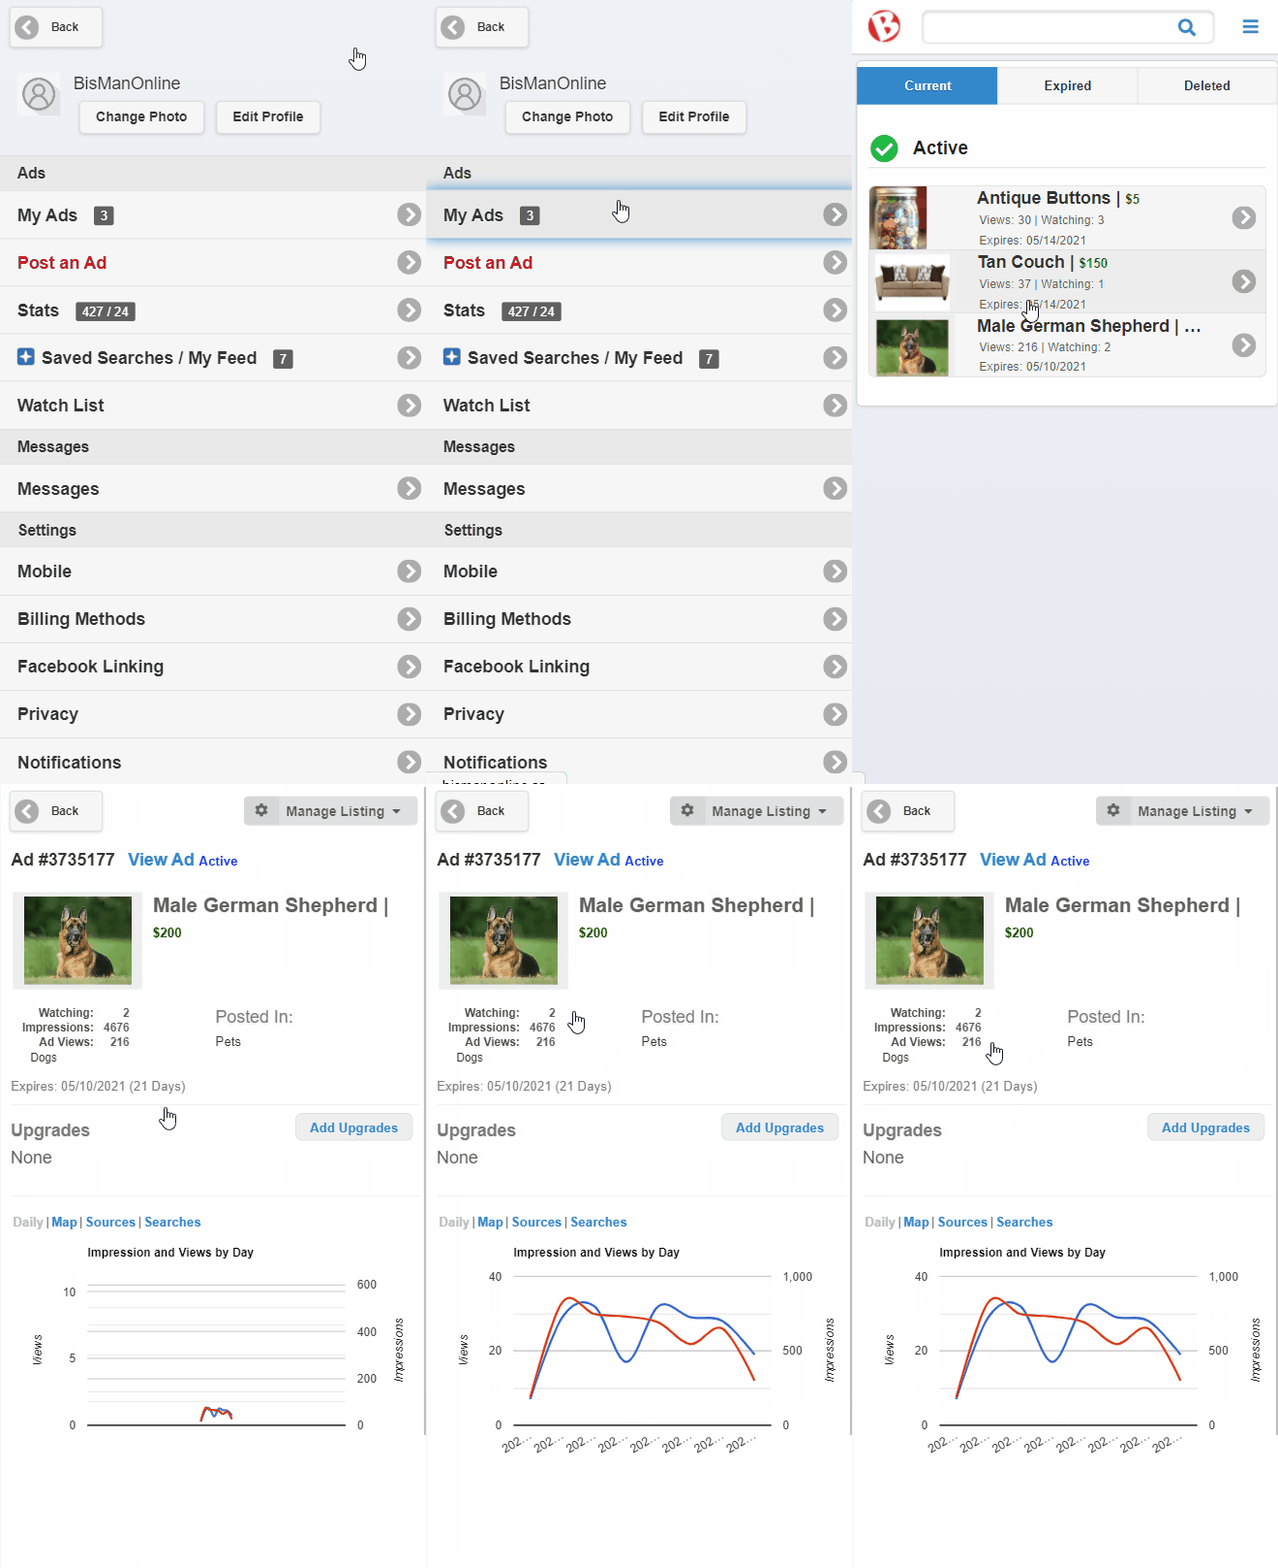
To view an ad’s statistics, log in to your BisManOnline account and click the Member Center icon.
Click ‘My Ads,’ then click on the ad for which you would like to view the statistics. This will open the ad and display that ad’s statistics, the first of which includes the total Watching, Impressions, and Views for the entire period the ad has been listed. For an explanation of these terms, please view our support topic Differences Between Watching, Impressions, & Views.
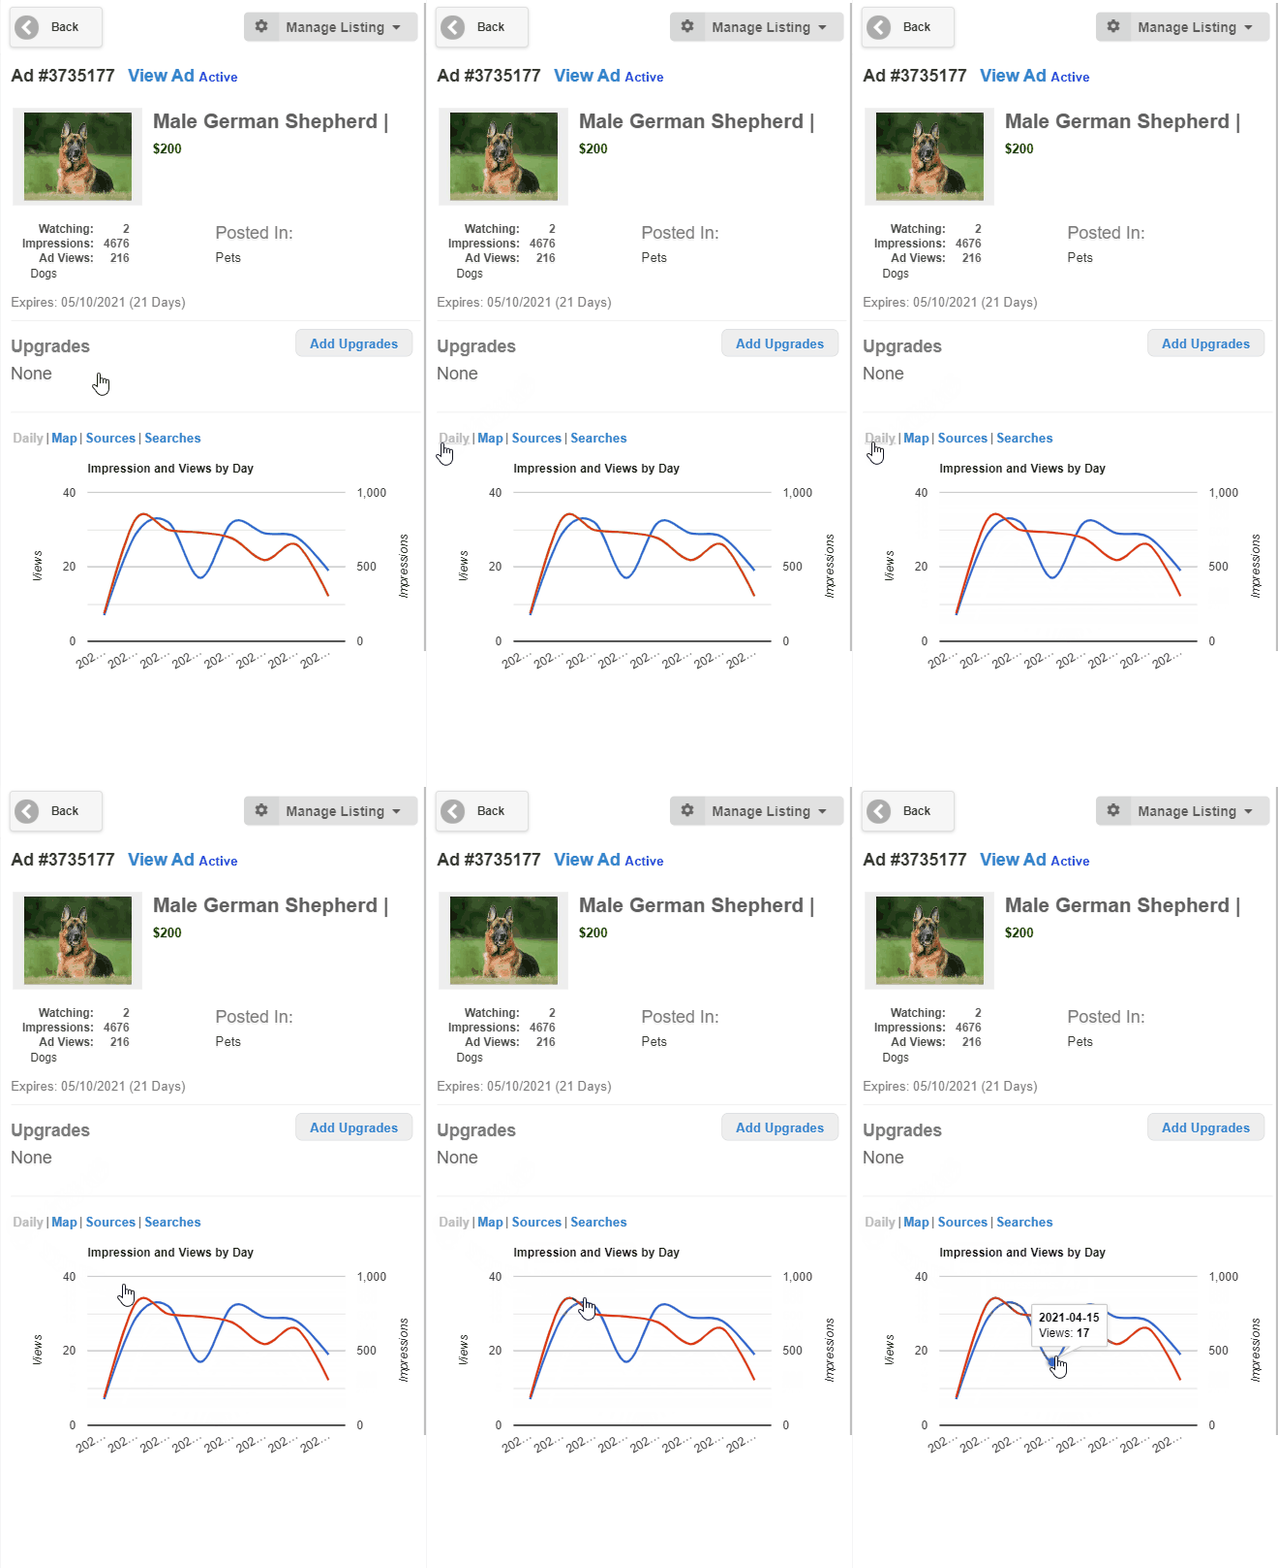
Click ‘Daily.’ This line graph tracks the impressions and views that your ad receives each day. The blue line represents your views, and the red line represents your impressions. Tapping on various points of either of the two lines, the date and exact view or impression count will display.
Click ‘Map.’ This map tracks the locations from which users have viewed your ads. These locations are determined by using the IP Address of the computer that viewed your ad. Tapping on any of the states will give you the total view count for that state.

Click ‘Sources.’ This bar graph tracks from which areas on the site you are receiving your impressions. Tapping on any of the bars will display the total count for that source.
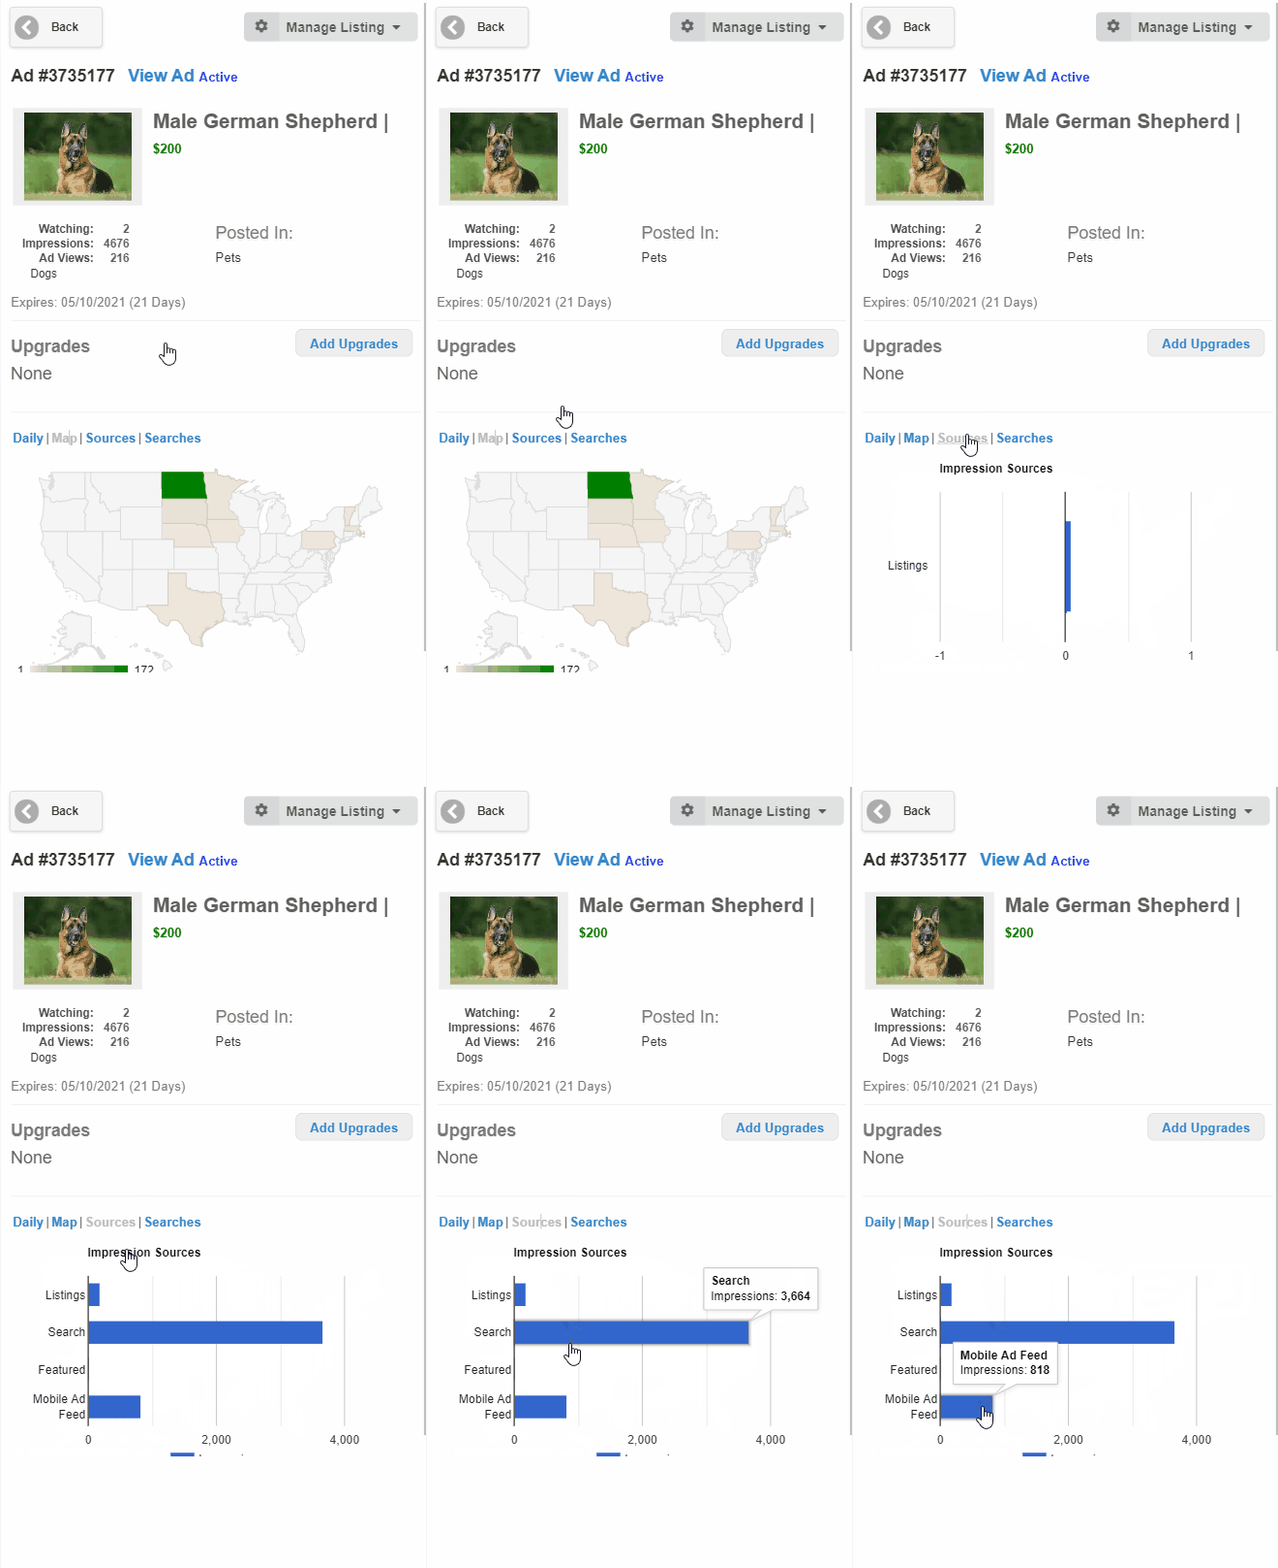
Click ‘Searches.’ This table tracks searches that were conducted on BisManOnline that led people to click on your ad.

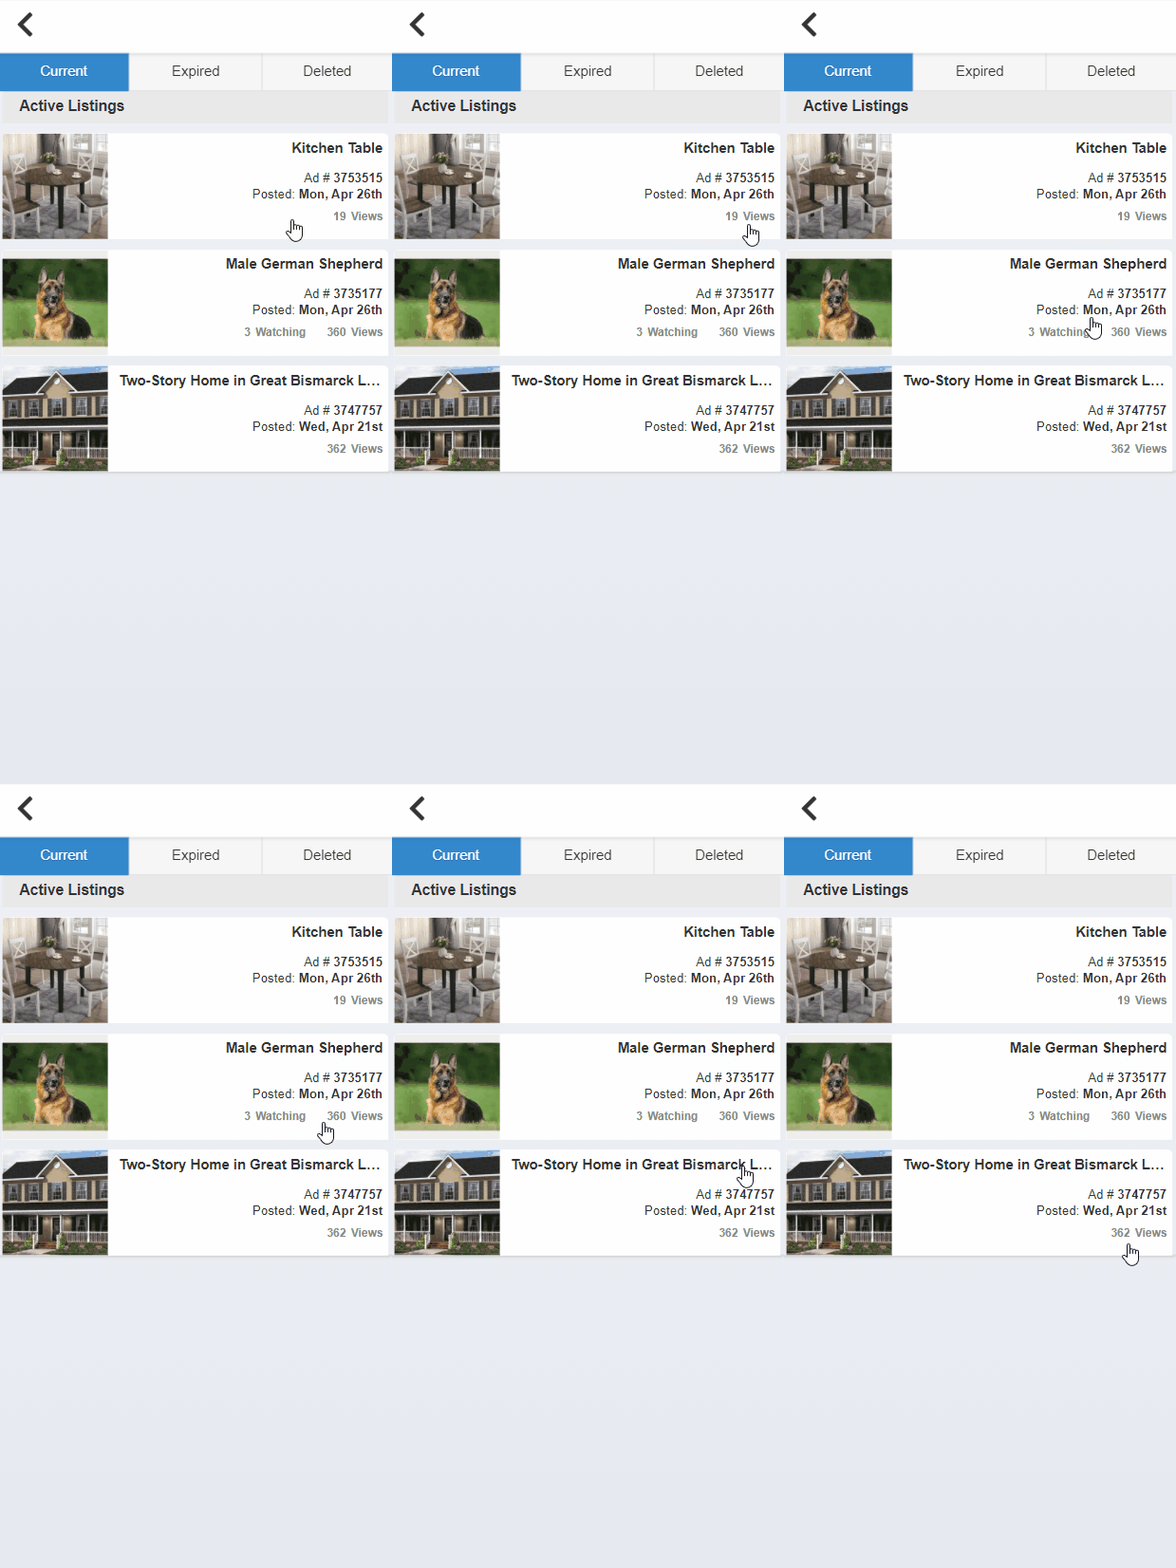
To view an ad’s statistics, log in to your BisManOnline account and click the Person icon.
![]()
Click ‘My Listings.’

Each listing will display a count for total Views, as well as total users Watching (if there are any users watching your ad). For an explanation of these terms, please view our support topic Differences Between Watching, Impressions, & Views.
